Denver Realtor

Every Home Deserves a KILTED Closing

  • Buy
    • Search for Homes
    • Mortgage Interest Rates and Mortgage Payment Calculator
    • Renting vs. Buying
    • Relocation
    • Rent-To-Own
    • My Listings
    • Resources for Buyers
  • Sell
    • Request Home Valuation
    • Resources for Sellers
    • Divorce and Selling Your House
  • Invest
  • Communities
    • Denver Neighborhoods
    • Search Denver Homes
    • Search Arvada Homes
    • Search Aurora Homes
    • Search Broomfield Homes
    • Search Centennial Homes
    • Search Englewood Homes
    • Search Greenwood Village Homes
    • Search Highlands Ranch Homes
    • Search Lakewood Homes
    • Search Littleton Homes
    • Search Lone Tree Homes
    • Search Parker Homes
    • Search Westminster Homes
    • Search Wheat Ridge Homes
    • Salida Real Estate
  • Blog
    • Buying a Home
    • Selling a Home
    • Real Estate Market
    • Denver Housing Market
    • Financing a Home
    • Real Estate Investing
    • Renting
    • Homeownership
  • About
    • Kilted Closings (photos)
    • Why Choose Scott
    • Client Testimonials/Reviews
    • eXp Realty Colorado
  • Contact
    • Join eXp Realty
You are here: Home / Real Estate / 6 Simple Graphs Proving This Is Nothing Like Last Time

6 Simple Graphs Proving This Is Nothing Like Last Time

March 10, 2021

6 Simple Graphs Proving This Is Nothing Like Last Time

Last March, many involved in the residential housing industry feared the market would be crushed under the pressure of a once-in-a-lifetime pandemic. Instead, real estate had one of its best years ever. Home sales and prices were both up substantially over the year before. 2020 was so strong that many now fear the market’s exuberance mirrors that of the last housing boom and, as a result, we’re now headed for another crash.

However, there are many reasons this real estate market is nothing like 2008. Here are six visuals to show the dramatic differences.

1. Mortgage standards are nothing like they were back then.

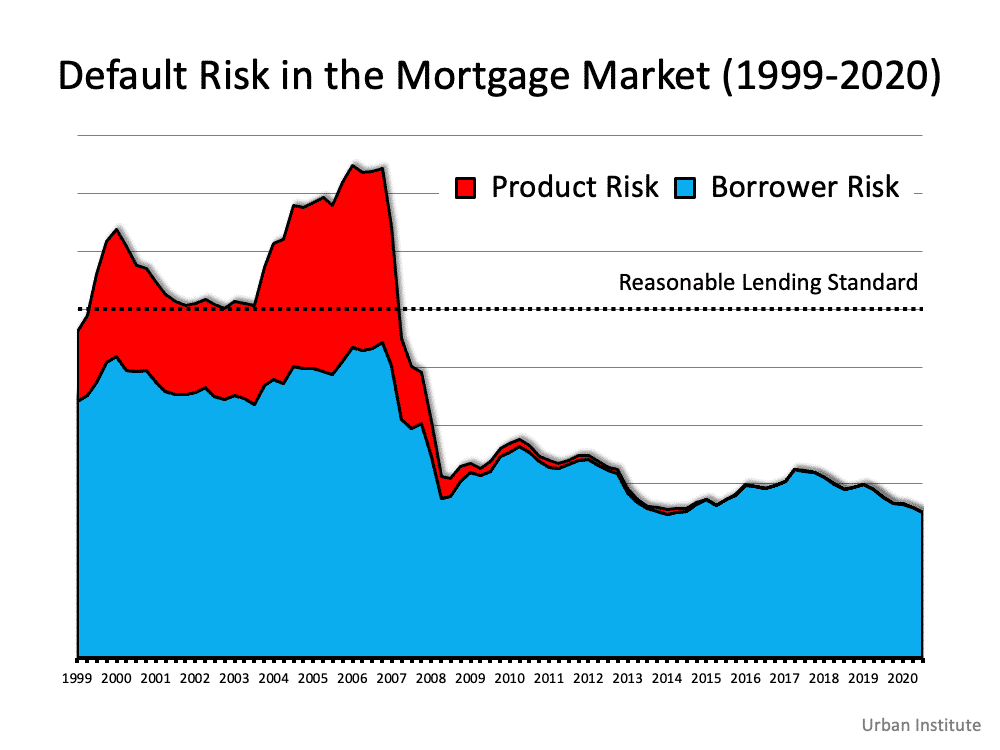
During the housing bubble, it was difficult not to get a mortgage. Today, it’s tough to qualify. Recently, the Urban Institute released their latest Housing Credit Availability Index (HCAI) which “measures the percentage of owner-occupied home purchase loans that are likely to default—that is, go unpaid for more than 90 days past their due date. A lower HCAI indicates that lenders are unwilling to tolerate defaults and are imposing tighter lending standards, making it harder to get a loan. A higher HCAI indicates that lenders are willing to tolerate defaults and are taking more risks, making it easier to get a loan.”

The index shows that lenders were comfortable taking on high levels of risk during the housing boom of 2004-2006. It also reveals that today, the HCAI is under 5 percent, which is the lowest it’s been since the introduction of the index. The report explains:

“Significant space remains to safely expand the credit box. If the current default risk was doubled across all channels, risk would still be well within the pre-crisis standard of 12.5 percent from 2001 to 2003 for the whole mortgage market.”
6 Simple Graphs Proving This Is Nothing Like Last TimeThis is nothing like the last time.

2. Prices aren’t soaring out of control.

Below is a graph showing annual home price appreciation over the past four years compared to the four years leading up to the height of the housing bubble. Though price appreciation was quite strong last year, it’s nowhere near the rise in prices that preceded the crash.6 Simple Graphs Proving This Is Nothing Like Last TimeThere’s a stark difference between these two periods of time. Normal appreciation is 3.8%. So, while current appreciation is higher than the historic norm, it’s certainly not accelerating out of control as it did in the early 2000s.

This is nothing like the last time.

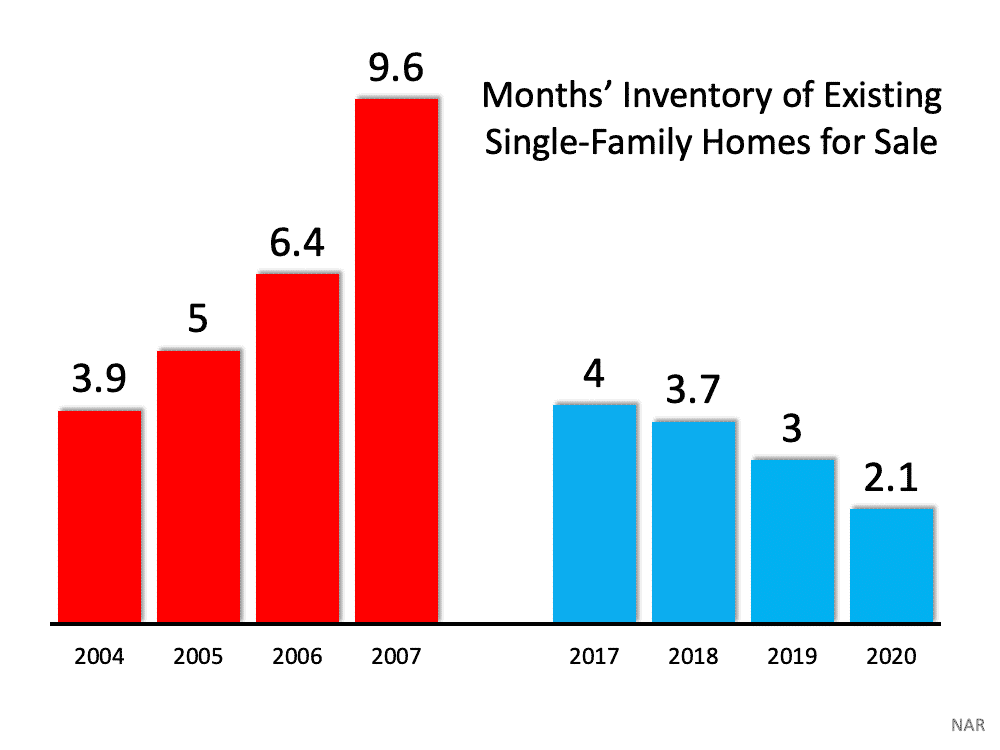
3. We don’t have a surplus of homes on the market. We have a shortage.

The months’ supply of inventory needed to sustain a normal real estate market is approximately six months. Anything more than that is an overabundance and will causes prices to depreciate. Anything less than that is a shortage and will lead to continued appreciation. As the next graph shows, there were too many homes for sale in 2007, and that caused prices to tumble. Today, there’s a shortage of inventory, which is causing an acceleration in home values.6 Simple Graphs Proving This Is Nothing Like Last TimeThis is nothing like the last time.
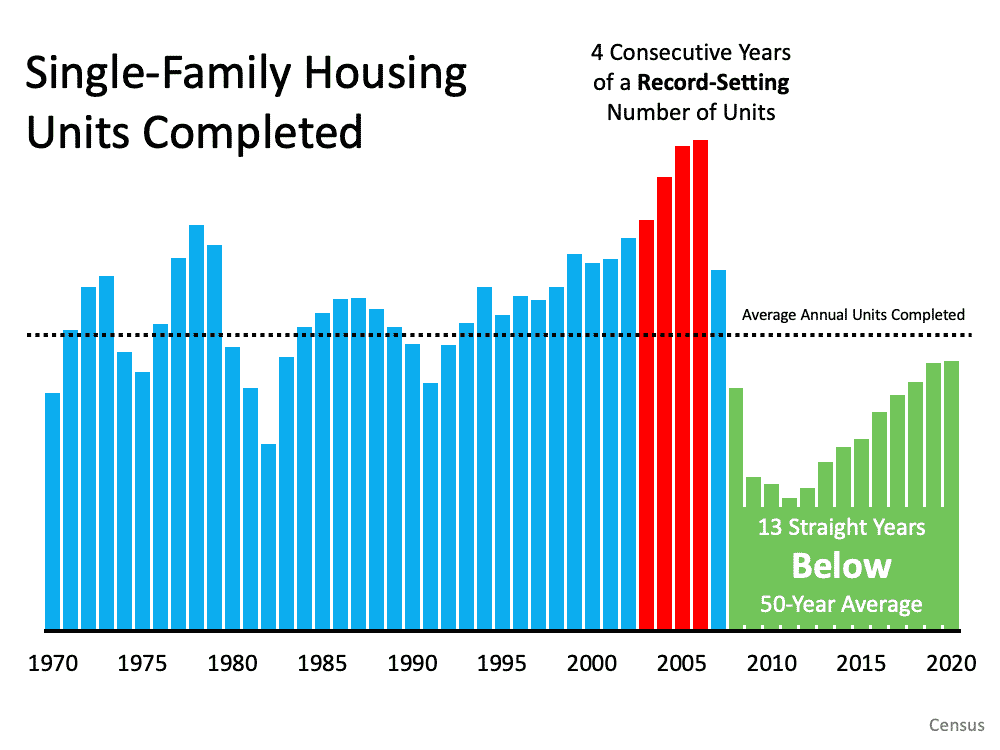
4. New construction isn’t making up the difference in inventory needed.

Some may think new construction is filling the void. However, if we compare today to right before the housing crash, we can see that an overabundance of newly built homes was a major challenge then, but isn’t now.6 Simple Graphs Proving This Is Nothing Like Last TimeThis is nothing like the last time.
5. Houses aren’t becoming too expensive to buy.

The affordability formula has three components: the price of the home, the wages earned by the purchaser, and the mortgage rate available at the time. Fifteen years ago, prices were high, wages were low, and mortgage rates were over 6%. Today, prices are still high. Wages, however, have increased, and the mortgage rate is about 3%. That means the average homeowner pays less of their monthly income toward their mortgage payment than they did back then. Here’s a chart showing that difference:6 Simple Graphs Proving This Is Nothing Like Last TimeAs Mark Fleming, Chief Economist for First American, explains:
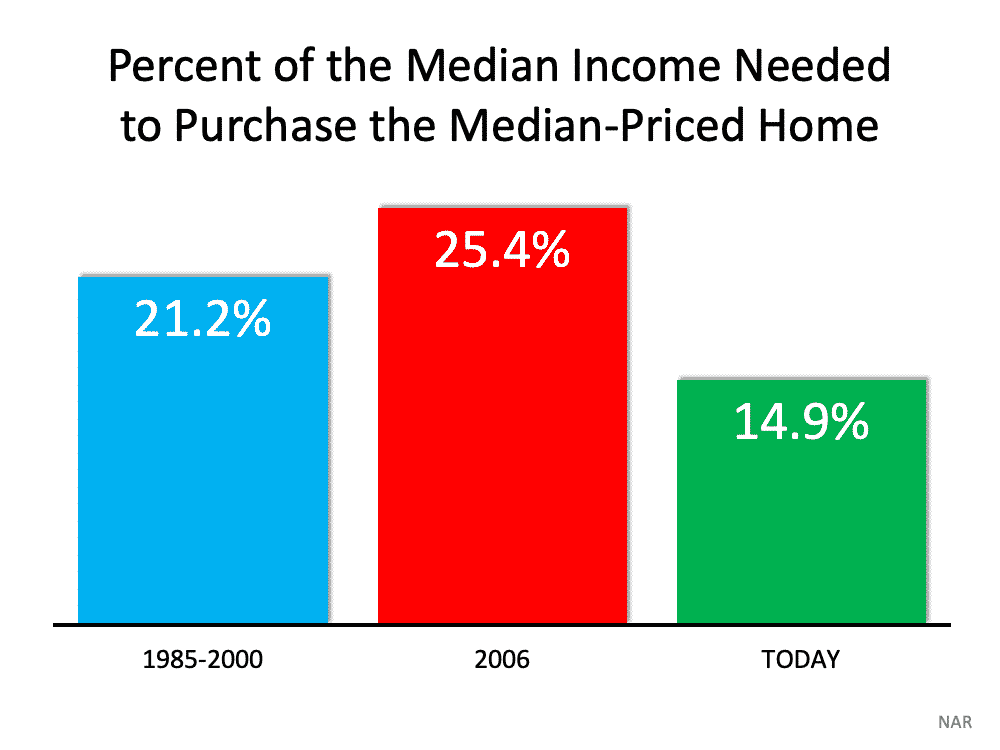
“Lower mortgage interest rates and rising incomes correspond with higher house prices as home buyers can afford to borrow and buy more. If housing is appropriately valued, house-buying power should equal or outpace the median sale price of a home. Looking back at the bubble years, house prices exceeded house-buying power in 2006, but today house-buying power is nearly twice as high as the median sale price nationally.”

This is nothing like the last time.

6. People are equity rich, not tapped out.

In the run-up to the housing bubble, homeowners were using their homes as personal ATM machines. Many immediately withdrew their equity once it built up, and they learned their lesson in the process. Prices have risen nicely over the last few years, leading to over 50% of homes in the country having greater than 50% equity – and owners have not been tapping into it like the last time. Here’s a table comparing the equity withdrawal over the last three years compared to 2005, 2006, and 2007. Homeowners have cashed out almost $500 billion dollars less than before:6 Simple Graphs Proving This Is Nothing Like Last TimeDuring the crash, home values began to fall, and sellers found themselves in a negative equity situation (where the amount of the mortgage they owed was greater than the value of their home). Some decided to walk away from their homes, and that led to a wave of distressed property listings (foreclosures and short sales), which sold at huge discounts, thus lowering the value of other homes in the area. With the average home equity now standing at over $190,000, this won’t happen today.

This is nothing like the last time.

Bottom Line

If you’re concerned that we’re making the same mistakes that led to the housing crash, take a look at the charts and graphs above to help alleviate your fears.

Starting Your Home Search Is Easy

home buyers guide
FREE Buyers Guide
Starting the home buying process is easy and involves a few simple steps: Download my Home Buyers Guide to learn general information. Search for homes currently on the market to get a feel for the types of homes, locations, and price points available. And of course, please call me, or send me an email / text, to discuss any thoughts about your next home, the buying process, and the most important next step. When in doubt, just call me and I will help you with each step of your journey.

Get My List of Hot Properties »

Is Time To Sell Your Home?

guide for home sellers
FREE Sellers Guide
Find out how much your home is worth and download my free guide for home sellers for helpful information. It is important to choose a REALTOR® who can develop an effective marketing strategy for your property, negotiate well on your behalf, and has the knowledge to provide an accurate market comparison so you can determine the right asking price. The market changes each week and your asking price is an important component of your selling strategy. I am here to listen and serve, let me know if you want to know how your home stacks up against the competition, or how we can position your property to sell quickly and for a good price, or if you have unique circumstances or goals. Contact me today to start a discussion…

Get A Quick Home Valuation »

My Denver real estate blog has loads of useful information for home buyers trying to figure out what they want to do…
Real Estate Housing Market | Buying a Home | Selling a Home | Financing a Home | Renting | Homeownership | Investing

SHARE THIS:

  • Email
  • Print
  • Pocket
  • Facebook
  • Twitter
  • LinkedIn
  • More
  • Reddit
  • Tumblr
  • Pinterest
  • Telegram
  • WhatsApp
  • Skype

Related

Topic: Real Estate

SUBSCRIBE: Receive a Weekly Digest of This Blog in Your Email Inbox

/ ( mm / dd )
(No SPAM. Just good content. Safe unsubscribe anytime.)

DENVER REAL ESTATE & HOUSING BLOG

scott rodgers realtor blogHi, I'm Scott Rodgers, a native of Denver and a professional Realtor serving the metro Denver metro area. In short, I help people buy and sell homes, and have built a bit of a reputation wearing a kilt to my clients' closings.

Follow this daily blog on the Denver housing market and real estate related topics for highly relevant information for home buyers and sellers.

And should you or someone you know be in the market to buy or sell a home, please reach out to me to discuss what you are looking to do. I adapt to all my clients' needs and strive to provide you with The Peak Results.

Find Your Next Home


Create Your Free Account
Get instant access to new inventory. Save searches and receive email alerts on new homes, price reductions, and status changes.
OR
Facebook
Google
Have an account?
Sign in

Nextdoor.com Favorite Agent Cory-Merrill Denver

FIVE STAR PROFESSIONAL AGENT 2022 Scott Rodgers

Scott Rodgers 2021 Top Agent Award

Denver Real Estate Blog

  • Real Estate Consistently Voted Best Investment [INFOGRAPHIC] July 1, 2022
  • If You’re Selling Your House This Summer, Hiring a Pro Is Critical June 30, 2022
  • Homeownership Could Be in Reach with Down Payment Assistance Programs June 29, 2022
  • A Key Opportunity for Homebuyers June 28, 2022
  • Two Reasons Why Today’s Housing Market Isn’t a Bubble June 27, 2022
  • Why an Agent Is Essential When Pricing Your House [INFOGRAPHIC] June 24, 2022
  • Homeownership Is a Great Hedge Against the Impact of Rising Inflation June 23, 2022
  • Things To Avoid After Applying for a Home Loan June 22, 2022
  • The Average Homeowner Gained $64K in Equity over the Past Year June 21, 2022
  • Why Achieving the Dream of Homeownership Can Be More Difficult for Some Americans June 20, 2022

Search Homes on Your Mobile

Visit www.ThePeak.com from your mobile phone and click the button below to search the MLS for homes with the best mobile user experience: fast, accurate, and easy to use.
Download App

Giving Back

Join my team on Kiva.org and help communities grow and prosper at the most foundational level: the individual, the family, the local business. It’s our way of spreading goodwill around the world. Participating is easy and involves small $25 loans.

  • Loans: 310+
  • Total Lent: $8,000+
  • Countries: 61

Scott Rodgers

Broker Associate, REALTOR®, MRP
The Peak Home Source
Buyer’s Agent for Bungalow
Lic. 100070676
303-242-8831 (m)

  • Email
  • Facebook
  • LinkedIn
  • StumbleUpon
  • Twitter
  • YouTube
the peak home source with scott rodgers - denver

Why Choose Scott Rodgers as your Realtor »     Write a Review / Recommend Scott »

24,761
Search homes in Denver, Centennial, Littleton, Lakewood, Englewood, Greenwood Village, Aurora, Lone Tree, Highlands Ranch, Parker, Wheat Ridge, Arvada, Westminster, Broomfield.
Copyright© 2016–2022 · The Peak Home Source with Scott Rodgers · Denver Realtor · MLS · Buy · Sell · Denver Real Estate Blog · Privacy · ToS

Marketing efforts are not intended to solicit properties listed under written agreement with licensed real estate brokers.
Website content is for informational purposes only. For professional advice or service, engage a licensed real estate broker, loan originator, attorney, or CPA under written contract.
Part of the real estate listing content on this website comes from the IDX program of REcolorado.

Go to mobile version