Highlights of the Denver metro real estate market update — September 2017 data
The Denver metro real estate market was quite hot the first 6 months of the year. July through September’s data shows the shift we expected toward a cooling market (relative to recent months, we’re still in a very tight inventory market).
Current market characteristics:
- Fewer buyers in the marketplace, which means buyers have more options.
- Homes tend to spend a bit more time on the market.
- Fewer bidding wars allow for some negotiation and a more relaxed buying experience.
- There isn’t a better time to move up – it is easier for buyers and sellers are more willing to compromise. If you are looking to sell your home and buy a new home, now is the time to do it! We anticipate the market to heat up again in January, making it harder for people who are buying with a “contingency” on the sale of their current home.
Here are some of the highlights from September’s data:
- Detached single family active units relatively flat with 4,970 available homes for sale which is an increase of 1.7% over the previous month. Attached single family reported also increased by 7.8% in active units up from August to September bringing the count to 1,754. Both markets together represent 6,724 units for sale.
- Average sold price showed seasonal decline in DSF at $469,109 as well as in ASF at $309,849.
- 4,777 homes were placed under contract. A balanced market with a 6 month supply of inventory would require 28,662 active units.
- Average days on market remain low heading into September with DSF at 25 days to contract and ASF 20.
- 0% of DSF and 49.9% of ASF homes were under contract in 7 days or less.
- Source: Megan Aller, Land Title Guarantee Company
(Scroll the PDF or click the arrow buttons for page-to-page navigation)
There are a lot of details here. I would be happy to help you understand how they relate to your situation and your real estate goals. Just shoot me an email or text, or give me a call.
Also, here are answers to a couple common questions: Are we in a bubble? And, renting vs buying. …
Is Denver’s real estate market in a bubble? We get that question a lot after the strong growth we’ve seen for several years. Price is a function of supply and demand. We simply do not have enough housing available for all the demand (people) in the area, so prices go up. Combine that with low mortgage interest rates — cheaper money — and buyers can afford to pay the sellers more for the same monthly payment, again pushing prices up. Below is a chart showing the supply of homes on the market in August 2007 and 2017. When we see the supply increase, it could be a sign of a reduction of pricing pressure and either flattening prices or possibly dropping prices. At this point, the data continues to point to upward momentum.
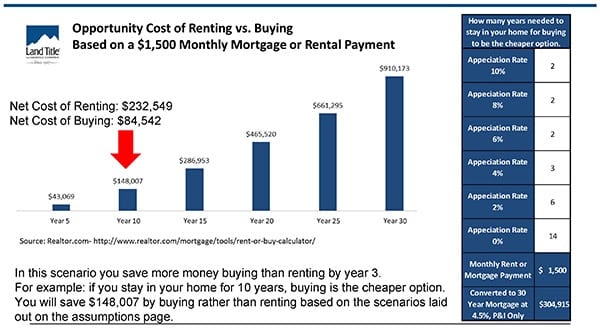
Megan Aller did a recent Rent vs. Buy cost analysis, I’ve included her comments below and would be happy to discuss your specific real estate goals.
A lot of questions surrounding lease renewal pop up at this time each year as buyers decide whether or not to continue to rent after a hard search for homes. I’ve included detailed breakdowns with nearly 20 different variables to better aid your buyers in making the decision to rent vs. buy – I’m sure you know which way we lean.
This calculation compares the total cost over time of renting with the total cost of buying. It includes the most common expenses of buying and renting and takes into account how these expenses are changed over time by applying the rate of inflation, home price and rent appreciation rates, and the rate of return on the investments. There are several other variables- which I cover on slides 12-13. Here is a snapshot of what the opportunity cost of renting vs. buying is at $1,500 per month.


 Hi, I'm
Leave a Reply